- From our Sponsors -
It’s no secret that I’m a huge fan of Google Analytics.
There aren’t many free, intuitive programs that give you the kind of super-valuable information that Google Analytics (GA) does.
It’s not just me, though. Marketing experts all over the world love it too. Some marketers use nothing else but GA to track their numbers and they are insanely successful with it.
But, I have to admit, GA can be a bit confusing, especially if you’re new to it.
My first “real” business was doing marketing consulting. I figured out pretty quickly that I needed to report real numbers to my clients.
I went to Google Analytics to get those numbers, but I quickly got overwhelmed.
There was way too much information! I didn’t know where to start!
That’s the thing about GA. It’s biggest upsides is also one of its biggest downsides: tons and tons of information!
Unless you’ve been using GA for a long time, you might be asking yourself the same question that I was asking in those early days: “What exactly should I be looking at?”
You don’t want to go down a rabbit hole that turns out to be a waste of time. You need the valuable stuff.
That’s why I want to show you how to get actionable data from GA in 10 minutes or less. I’ve been using GA for years and I know it doesn’t have to take forever to get the information that you need.
Just to be clear, this guide will take you more than ten minutes to read. That’s okay, though, because it’s going to save you hours in the long run!
With this guide, you won’t be staring at GA, scratching your head and thinking, “Where do I look?”
Don’t worry. I’ll give you the inside scoop and break everything down, step-by-step.
Ready? Let’s go!
I just started with zero, because there is a small caveat to this 10-minute process.
There’s a little bit of work that you’ll have to do before you can extract good data in 10 minutes or less.
But, don’t worry about this stage. It doesn’t take long at all.
You’re going to need to set up goals.
What are goals? Here’s how Google defines it:
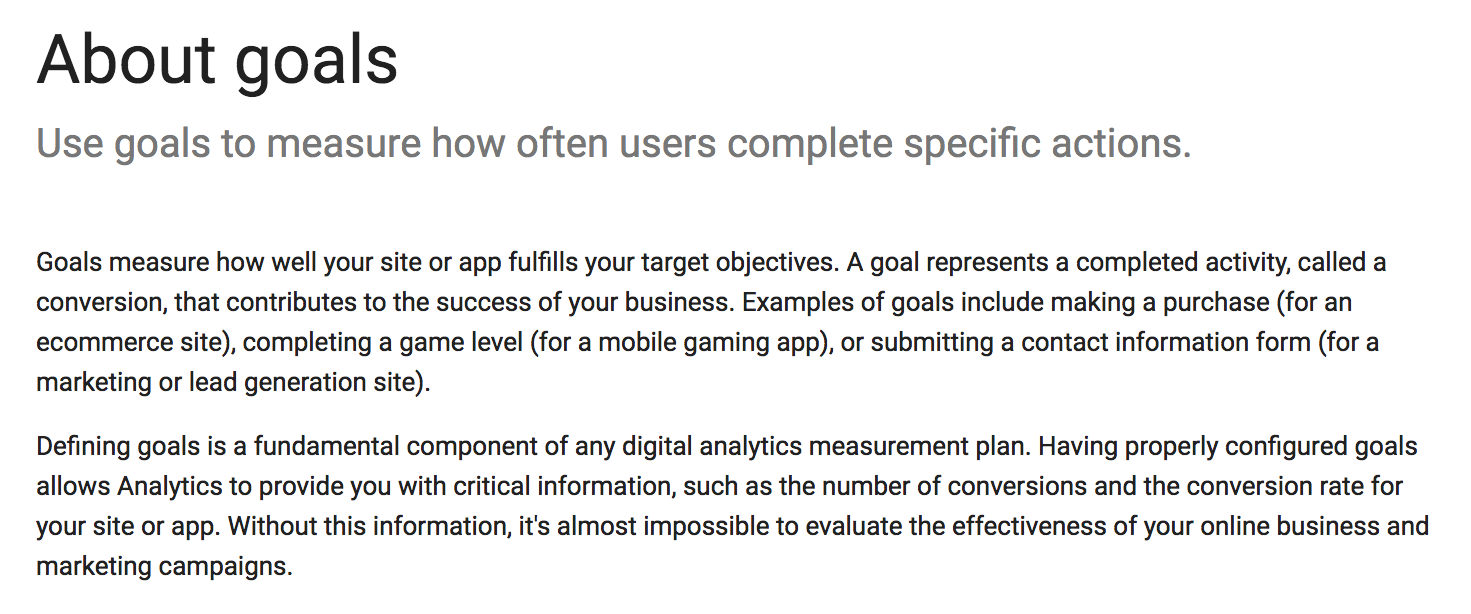
In other words, goals measure how and when people complete specific actions that you want them to complete.
For example, one of the goals that I have on my website is for people to click the orange button — “Yes! Reserve my seat now!”

I’ve set that as a goal, within my GA, because it’s one of the most important ways that I can add value to my readers (It’s a really good webinar).
Obviously, you can set a lot of goals, depending on what kind of information you’re looking for. On my blog, I’ve set up ten separate goals.

Once you set up a goal or multiple goals, the rest of GA will become much more usable. That’s because you’ll be measuring the data against your goals.
So, if your data looks good, you know you’re successfully fulfilling your goals. If your data is on the poor side, you’ll know your goals aren’t doing so well.
To get to the goals section, sign into Google Analytics.
Once you’re in, click the Admin tab.

You should see three columns. Click on the Goals link in the far right column.

This is your Goals section, where you can add new goals and modify existing ones. For this guide, I’ll start from scratch, so we can create a new goal together.

Click +NEW GOAL and you’ll see some options.
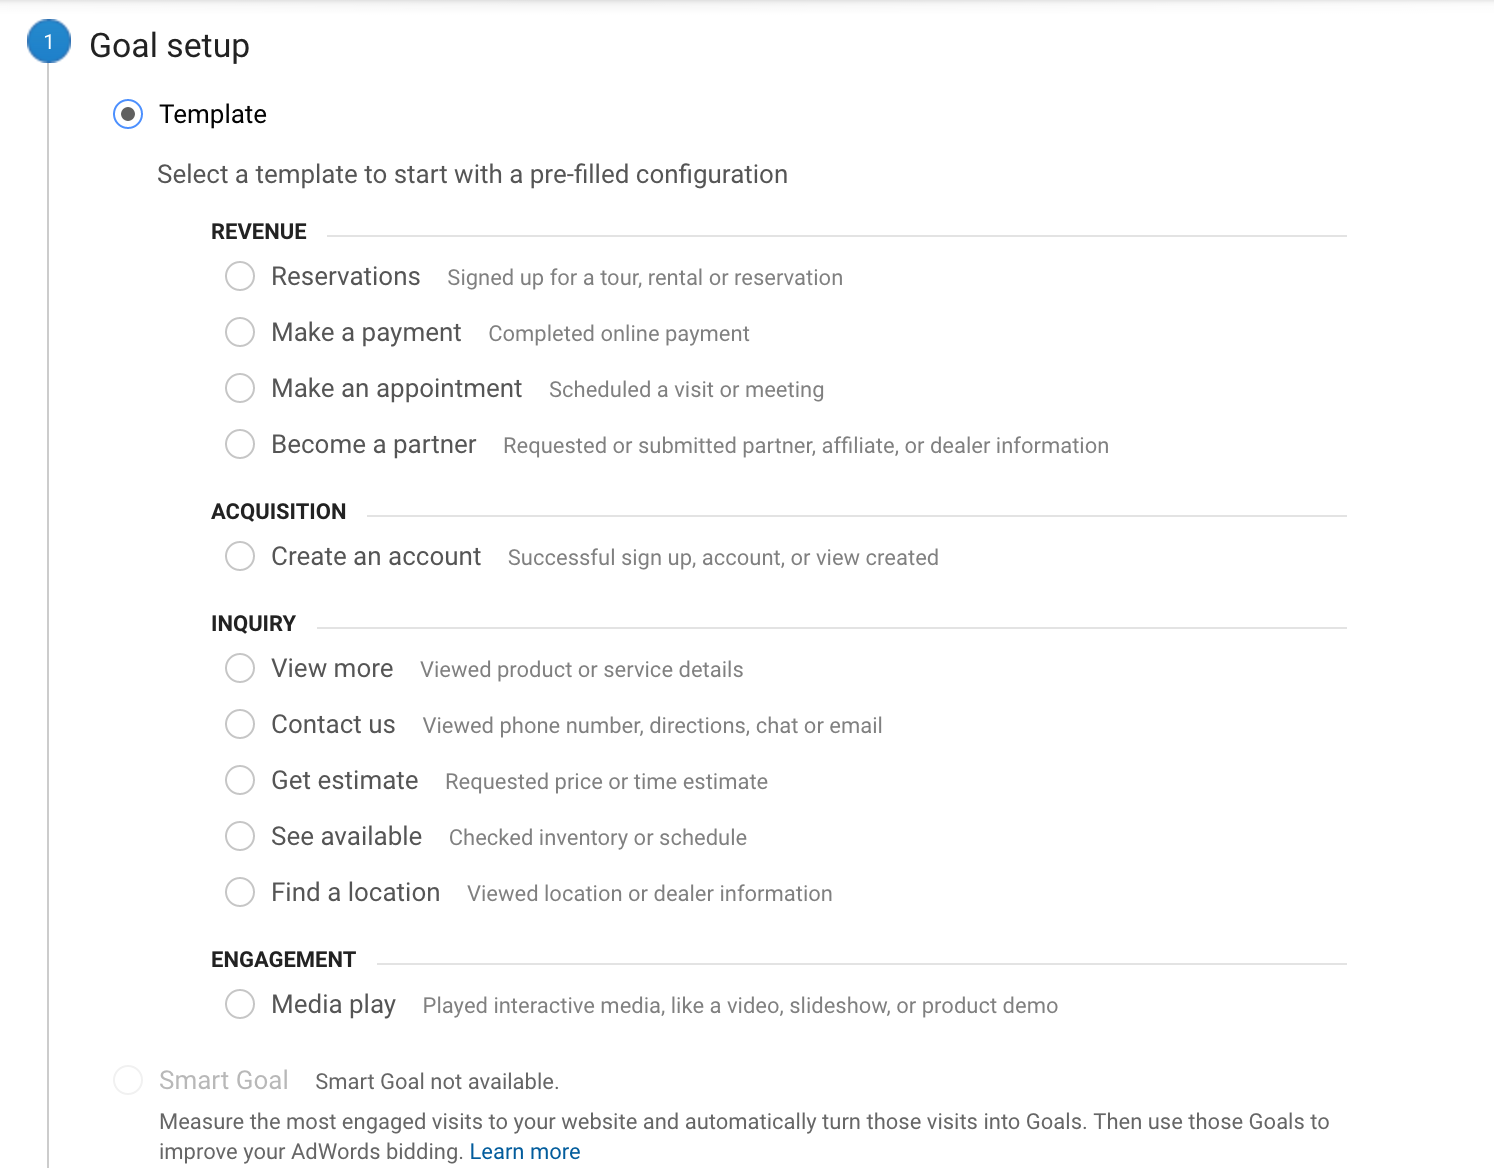
These are all templates that cover some of the most common business objectives. There are goals for making payments, setting up appointments and other important categories.
I love these options, because they make things really easy.
You can also create a custom goal by clicking the “Custom” radio button below the template section. For this article, we’ll stick with using a template. But, if you’re interested, here’s the official Google page on setting up custom goals.
Let’s choose the “Make a payment” template, since that’s all about the $$$!
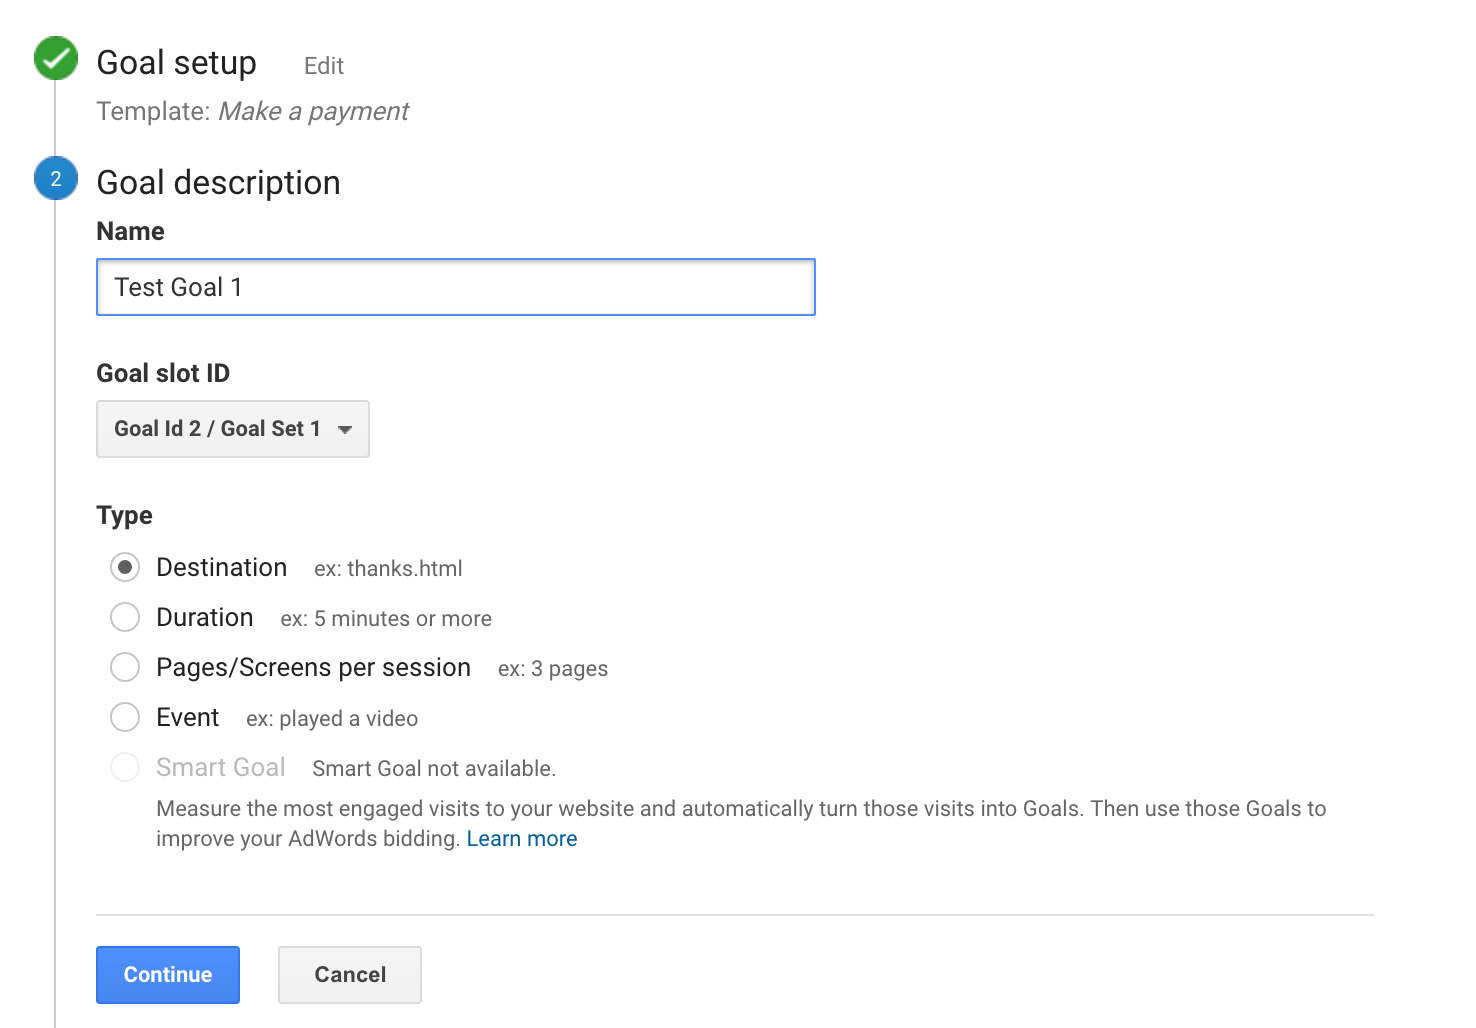
Select that option — “Make a payment” — and click Continue.
You can now name your goal and give it a type. Let’s make it a Destination.
This next part looks a little tricky. But, I promise you, it’s easier than you think!
Let’s say your checkout confirmation page is fakewebsite.com/checkout-confirmed (Original, I know).
In our case, you’d enter that URL into the bar and keep the “Equals to” option.
We won’t need to turn the Value option on.
However, you can turn the Funnel option on, to create a specific journey for your buyers to go through.
Let’s say that you want people to go from your homepage to a product page and then to a checkout page. Finally, they arrive at a thank you/confirmation page.
Here’s what that would look like in the Funnel:
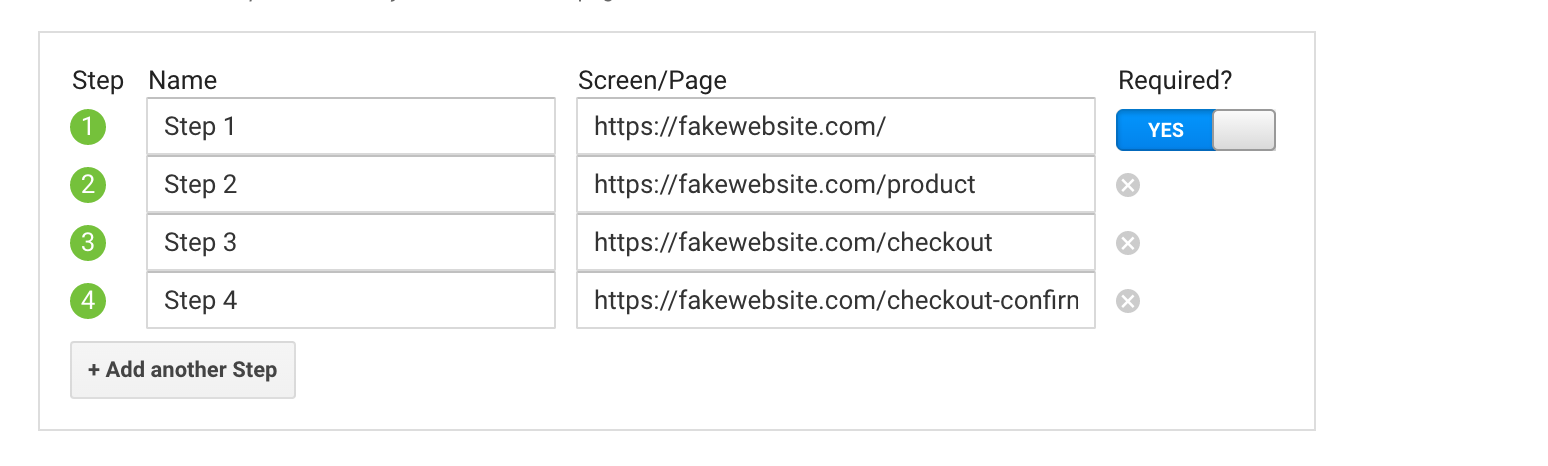
If you choose this, only buyers who go through this funnel will count as conversions.
After you’re done with this section, click Save. And, that’s it! You should see something like this:
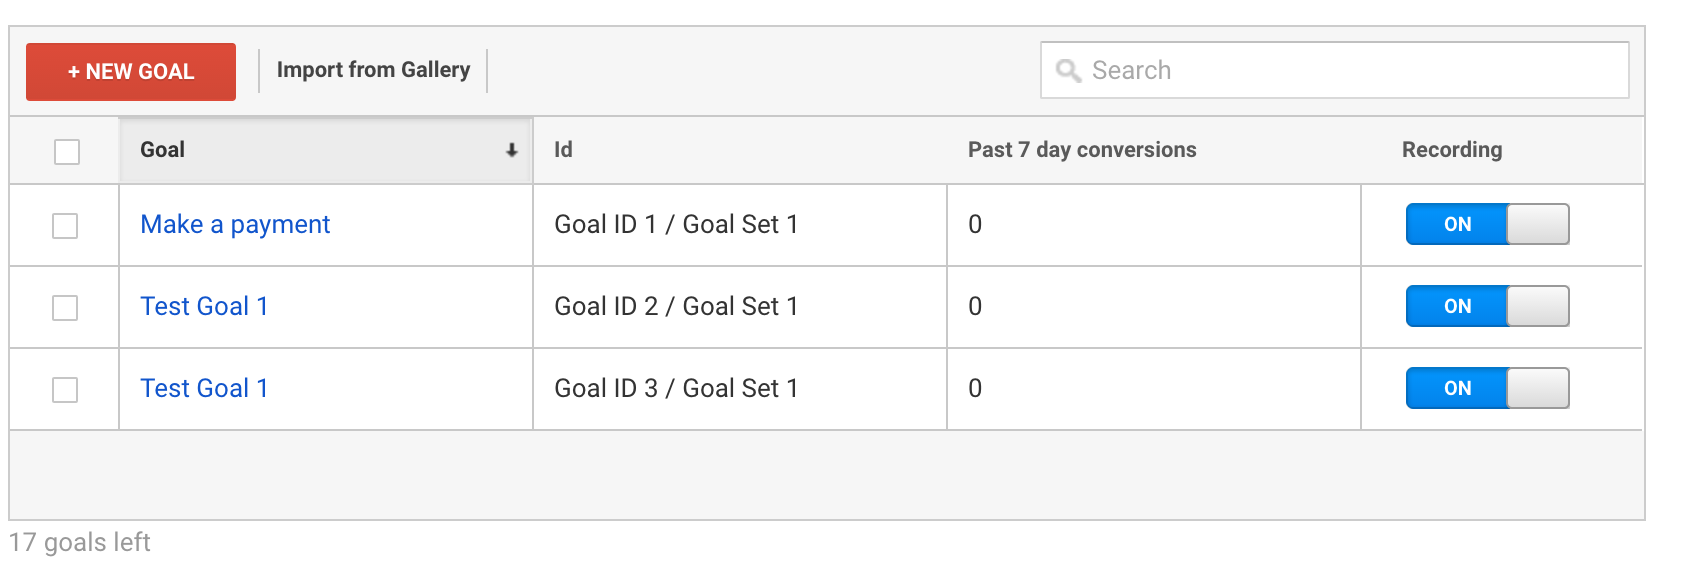
Your Goal is now live and recording, as the check box to the right notes.
If you want to read more about Goals, check out Google’s official entries here and here.
Now that you’ve got your goals set up, you can track all of your analytics with those goals in mind. You can set up multiple goals. In fact, I recommend you do so before moving on.
The more goals you’re tracking, the more actionable data you’ll be able to collect.
Once you’ve got your goals all set up, it’s time to begin the 10-minute countdown!
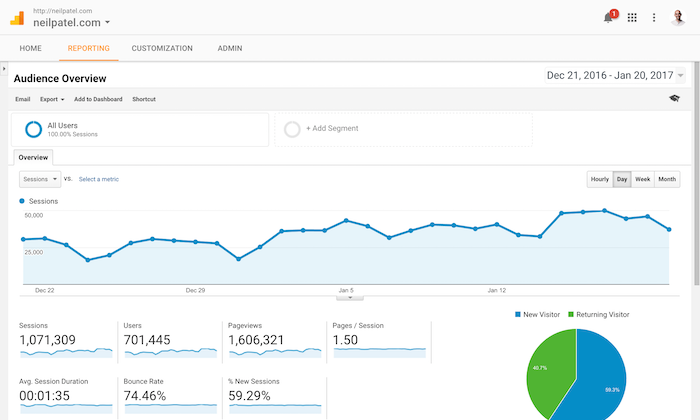
GA is excellent at providing demographics that can help you make the most of your marketing.
It can also show you some basic psychographics. Too few marketers make use of psychographics and it’s a shame––psychographics are highly useful and give you a ton of insight into why your audience behaves a certain way.
Let’s start with grabbing basic demographics.
In the Reporting tab, navigate to Audience > Demographics > Overview.
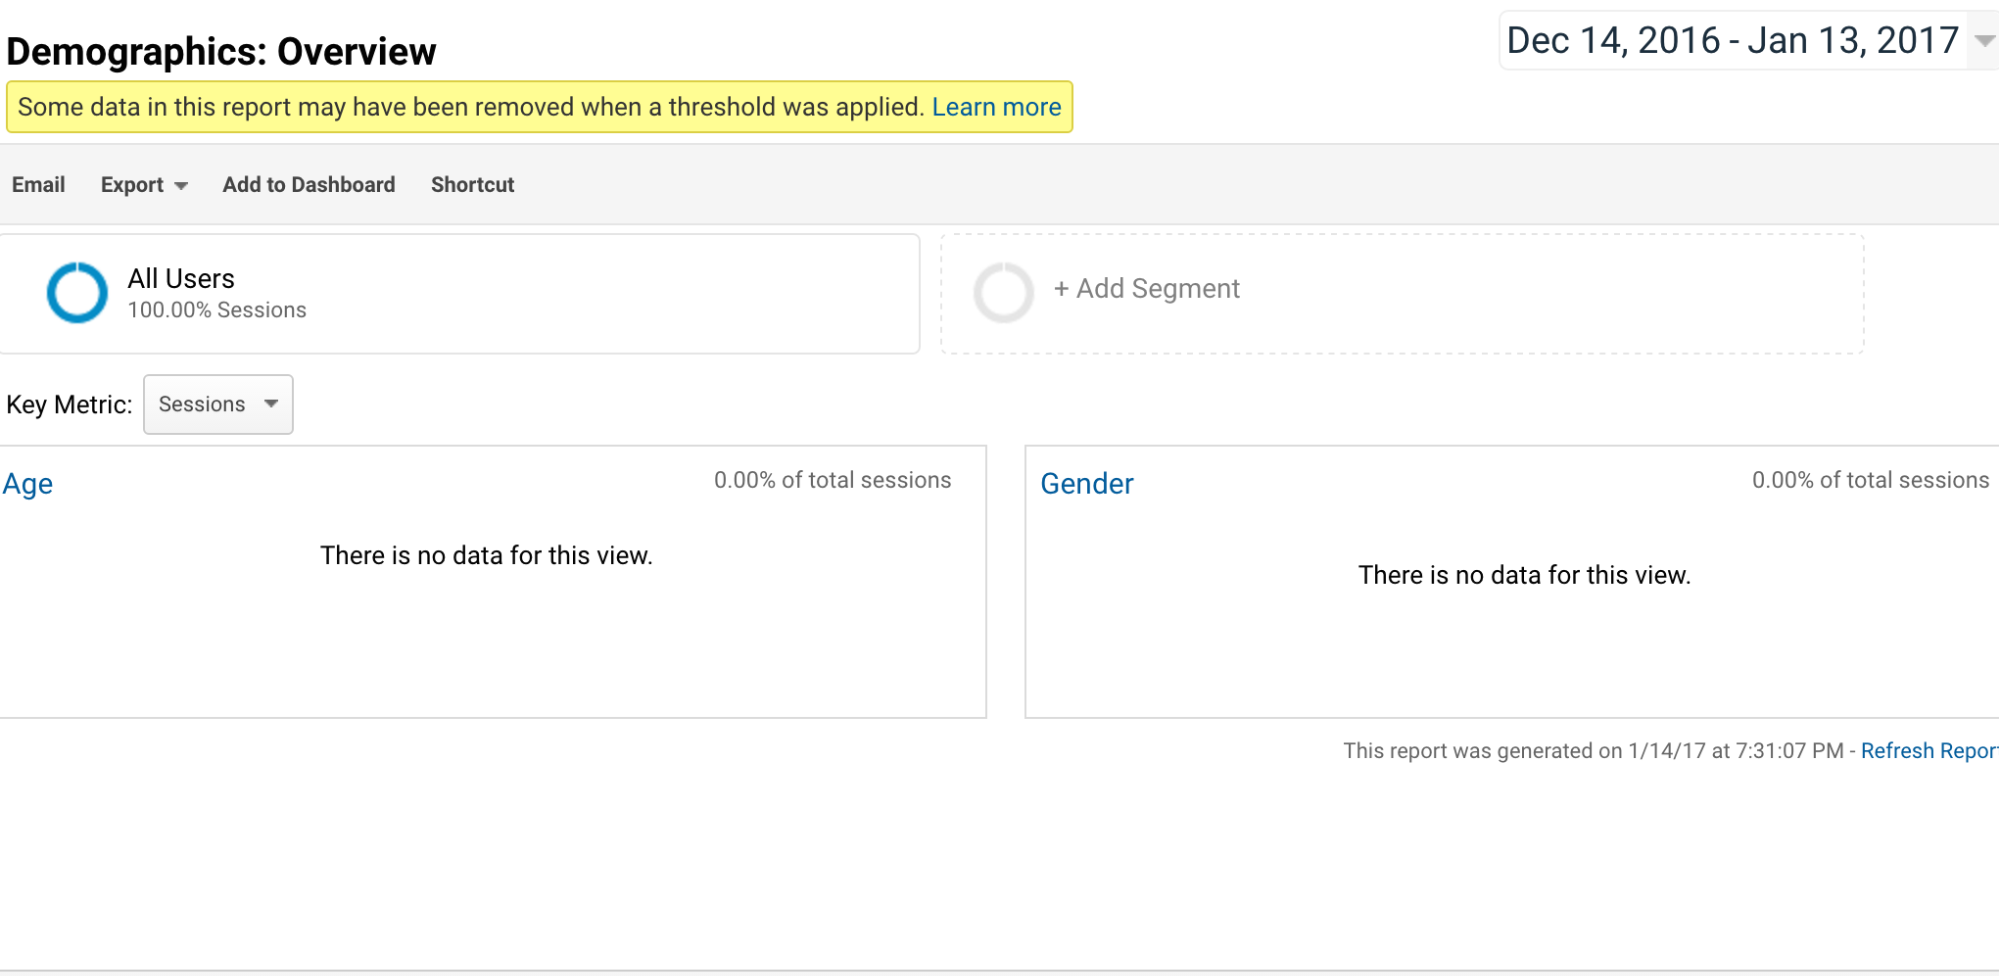
Here you can get a more detailed look at the age and gender ranges of your audience.
You can also find out where your readers are in the world and what language they speak.
To do this, head to Audience > Geo > Location.

This useful map provides a graphical view of reader locations. Scroll down and you’ll see a box that goes into more detail:
To see which languages your readers are using, go to Audience > Geo > Language. You’ll see another box full of specific information.
Even though this information is pretty basic, I think everyone using GA needs to know how to do this.
Referral information is something every marketer should know.
In this context, a referral is simply a page that leads people to your site. For example, if someone clicks a link on a blog post and goes to your site, then that post’s URL would be the referral.
In a matter of seconds, GA can tell you exactly how people are finding your site.
First of all, make sure that you’re on the Reporting tab of GA. It should look something like this:
In the left-hand column, click on Acquisition > All Traffic > Referrals.
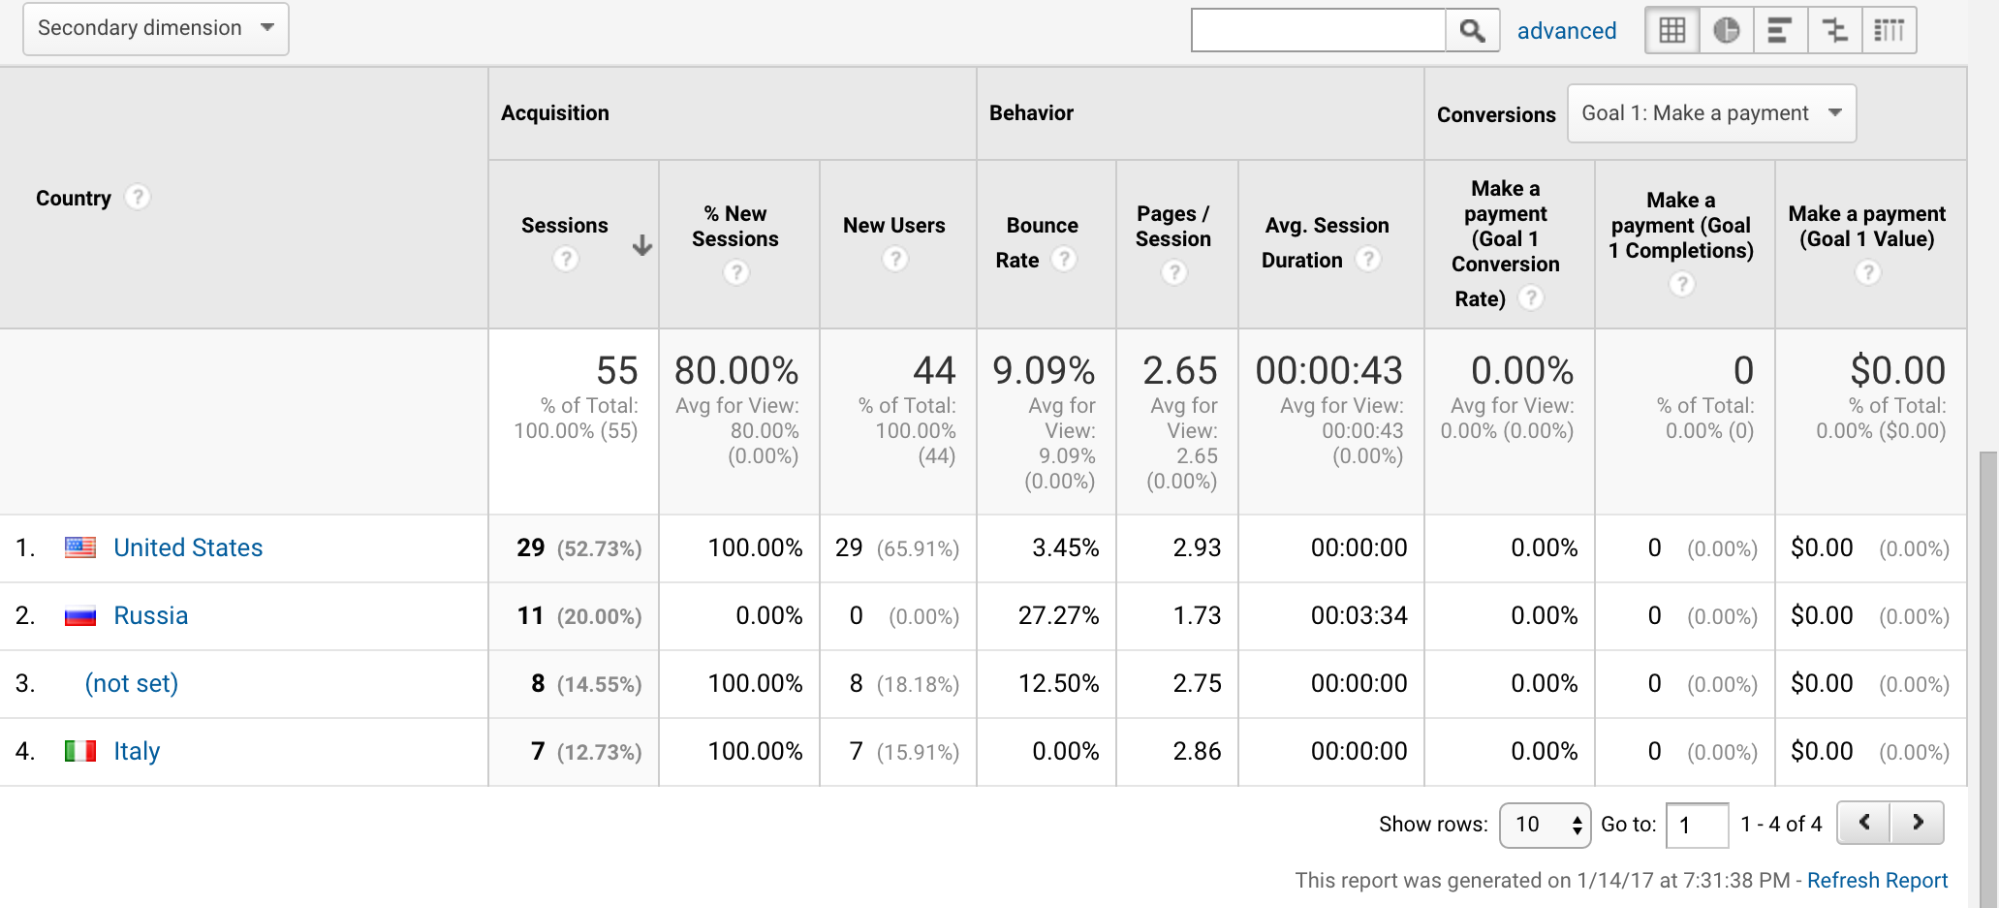
Scroll down to the table and you’ll see the sites that are sending traffic to your site.
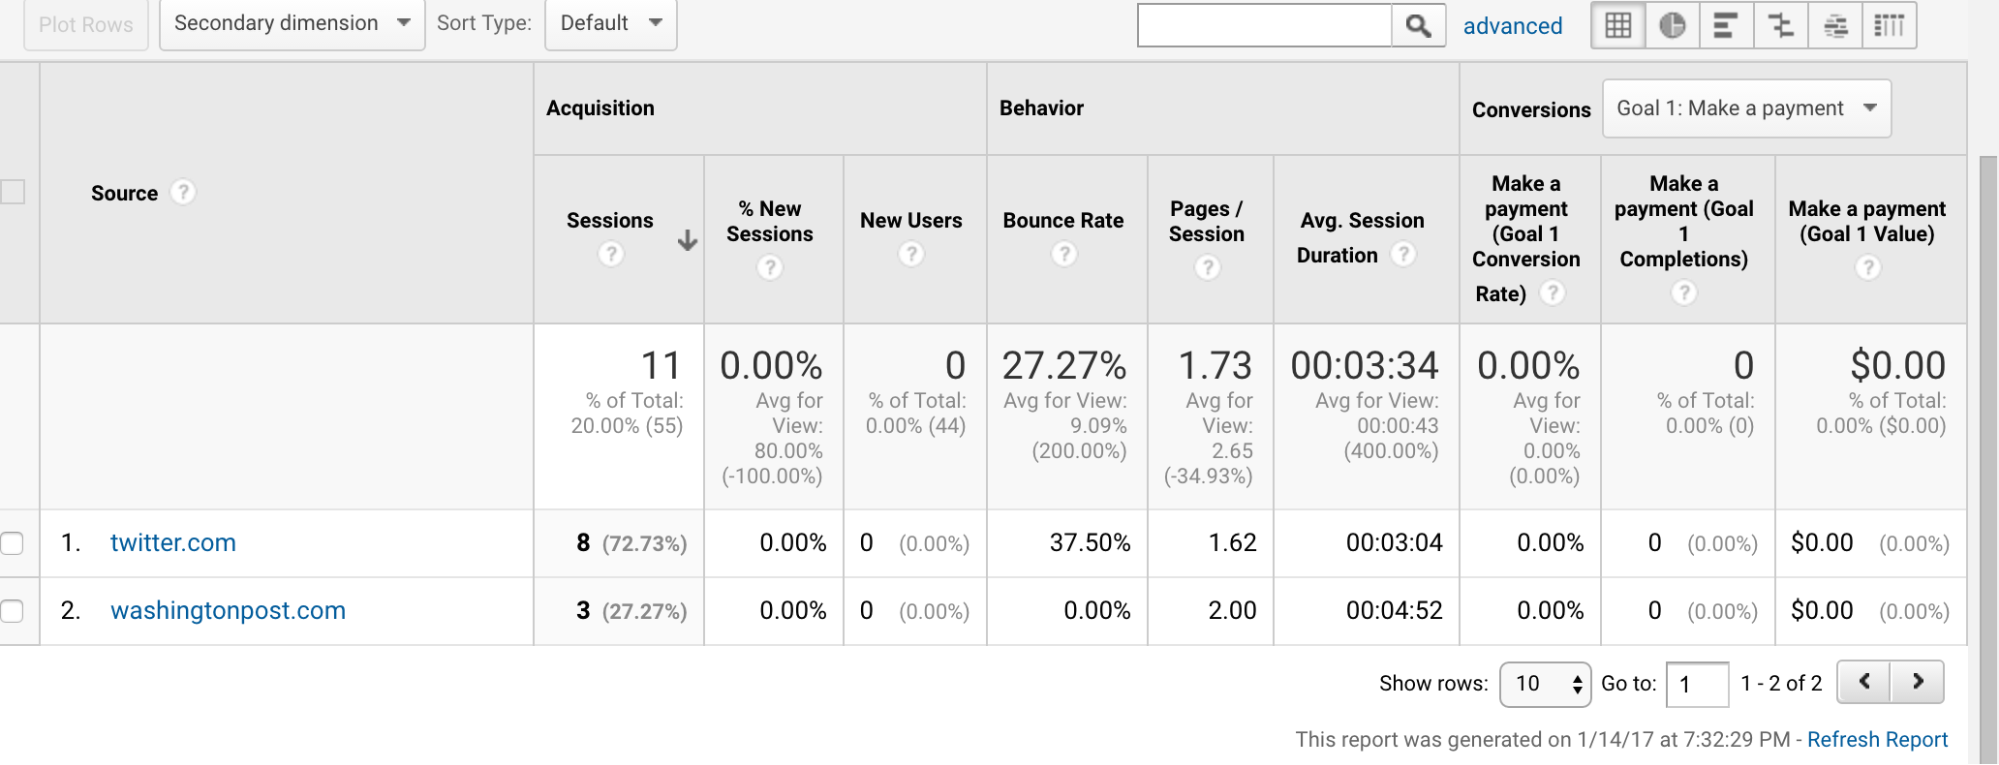
This table also gives you a ton of handy metrics, including number of sessions, bounce rate and goal conversion rate.
So, what does this mean for you?
Say a popular blog featured your product and lots of people who are coming from that blog are buying your product (and thus meeting your goal).
In this case, you’d know that the readers of the blog that featured you are your target audience. You might also consider reaching out to that blog again.
Knowing where your traffic is coming from can help you fine-tune your marketing strategies. This is powerful information that you shouldn’t overlook.
If you want to get the most out of your Referral analytics, check out this Kissmetrics article.
Even though there is a ton of research behind keyword optimization, there are still some surprises, now and then.
For example, you may be targeting several keywords and hoping to rank well for one. In reality, you might rank way better for a keyword you thought you’d have zero success with.
Uncovering your highest performing keywords has a lot of benefits, from SEO improvement to an increase in conversion rates.
Once you figure out what people are searching to find you, you can capitalize on those successful keywords to reach an even bigger audience.
To find your best performing keywords in GA, head to Acquisition > Overview.
Scroll down until you see this box:
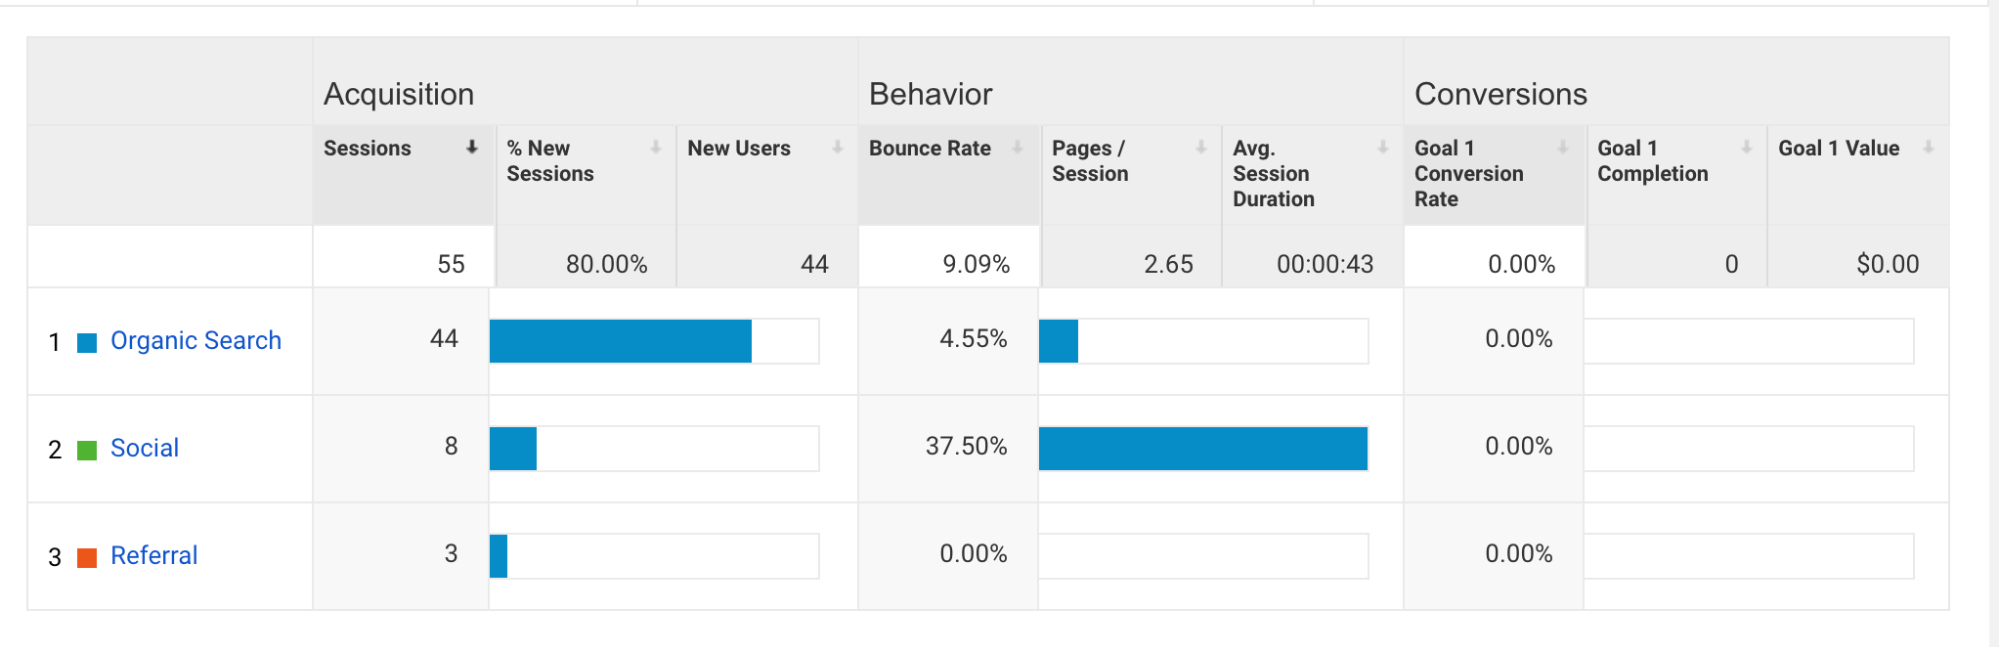
Click on Organic Search (It might not be in the #1 spot for you).
Now, scroll down until you see this Keyword box:
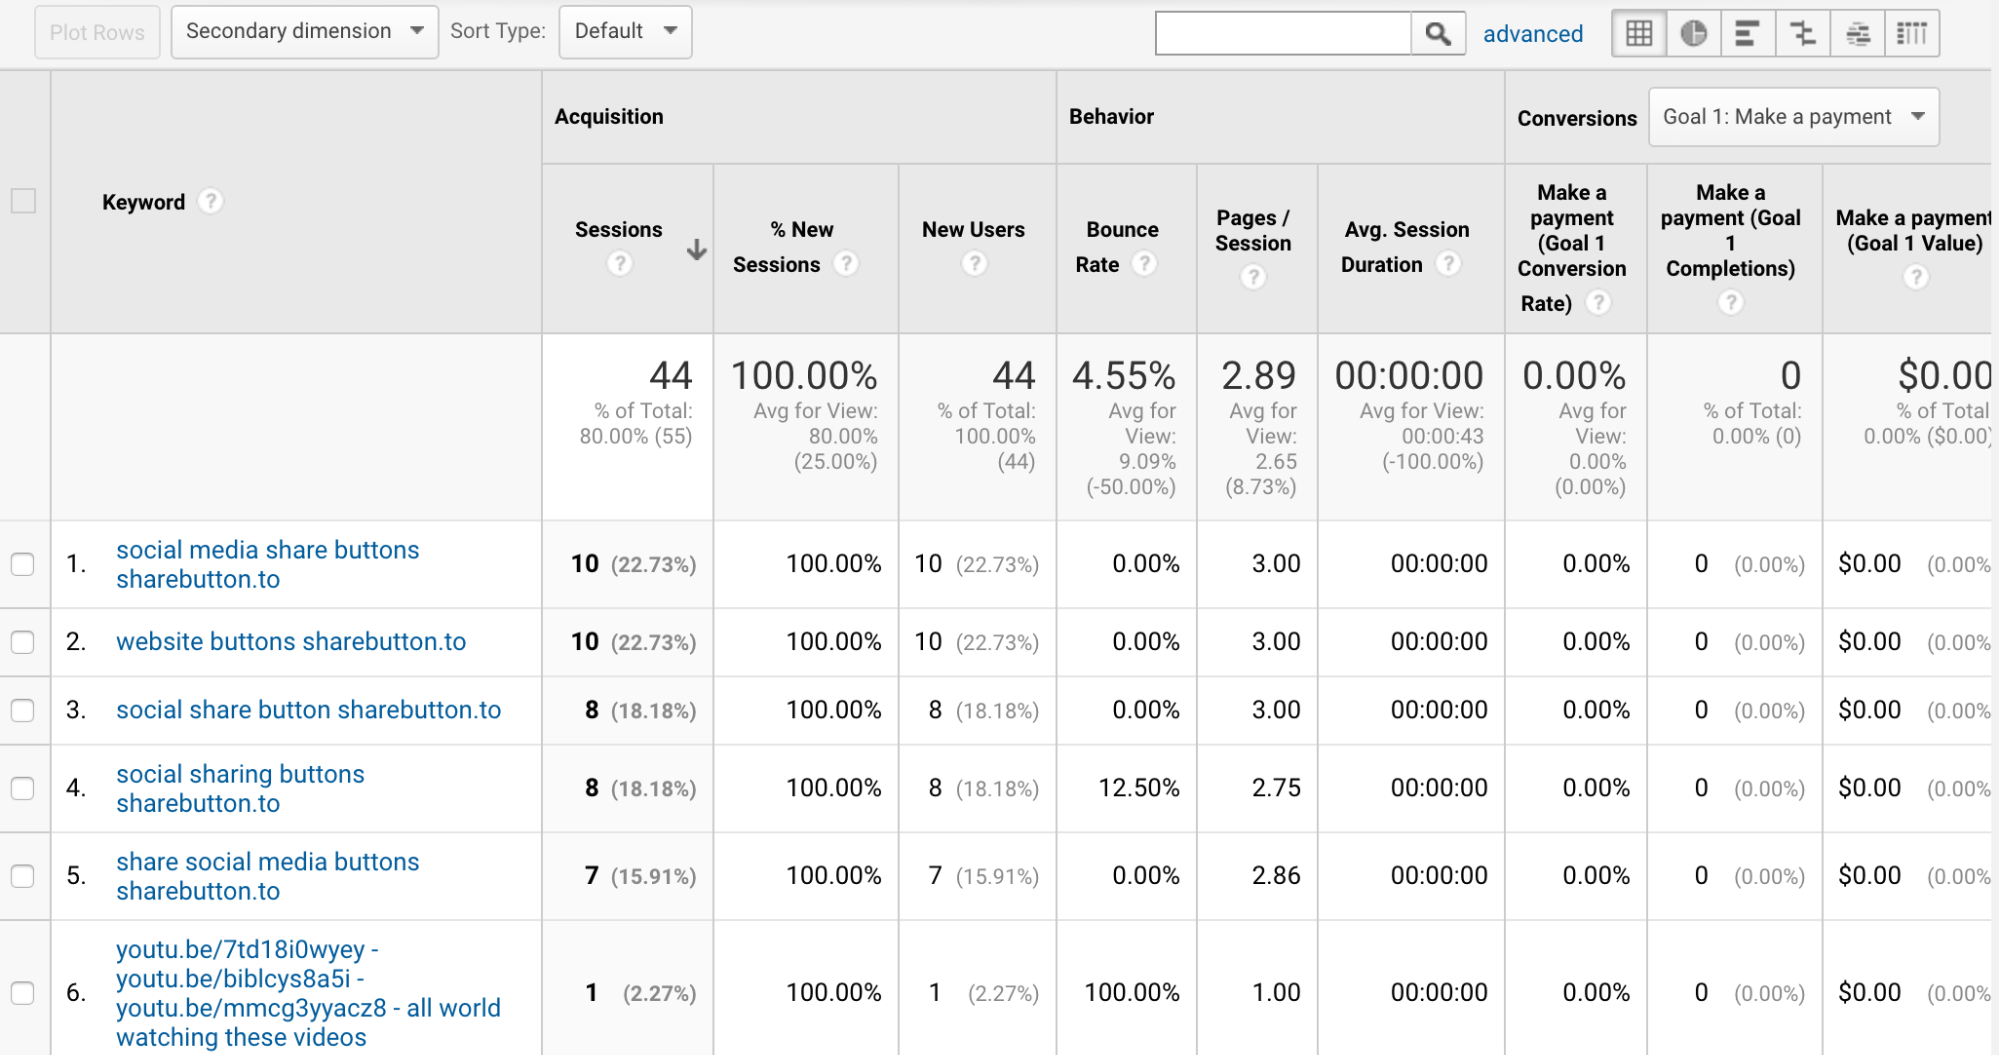
You might have noticed that this looks almost identical to the Referral box. This box gives you all of the same metrics, but for keywords.
Just like with Referrals, you can find out where people are coming from and how they’re contributing to your Goals.
If particular keywords work especially well for you, you can focus on those to bring in more traffic. If you want to read more about keyword optimization, here’s an excellent guide by Moz.
If you’ve noticed high bounce rates, you’re not alone. This is something that even I still struggle with.
Even if you know that your bounce rate is higher than it should be, you might not know why it’s so high. This is another situation where GA swoops in to save the day.
With GA, you can to dig deep, to find out why people are bouncing. We’ll start by looking at your most popular pages.
Navigate to Behavior > Site Content > All Pages.
You should see another familiar-looking box:
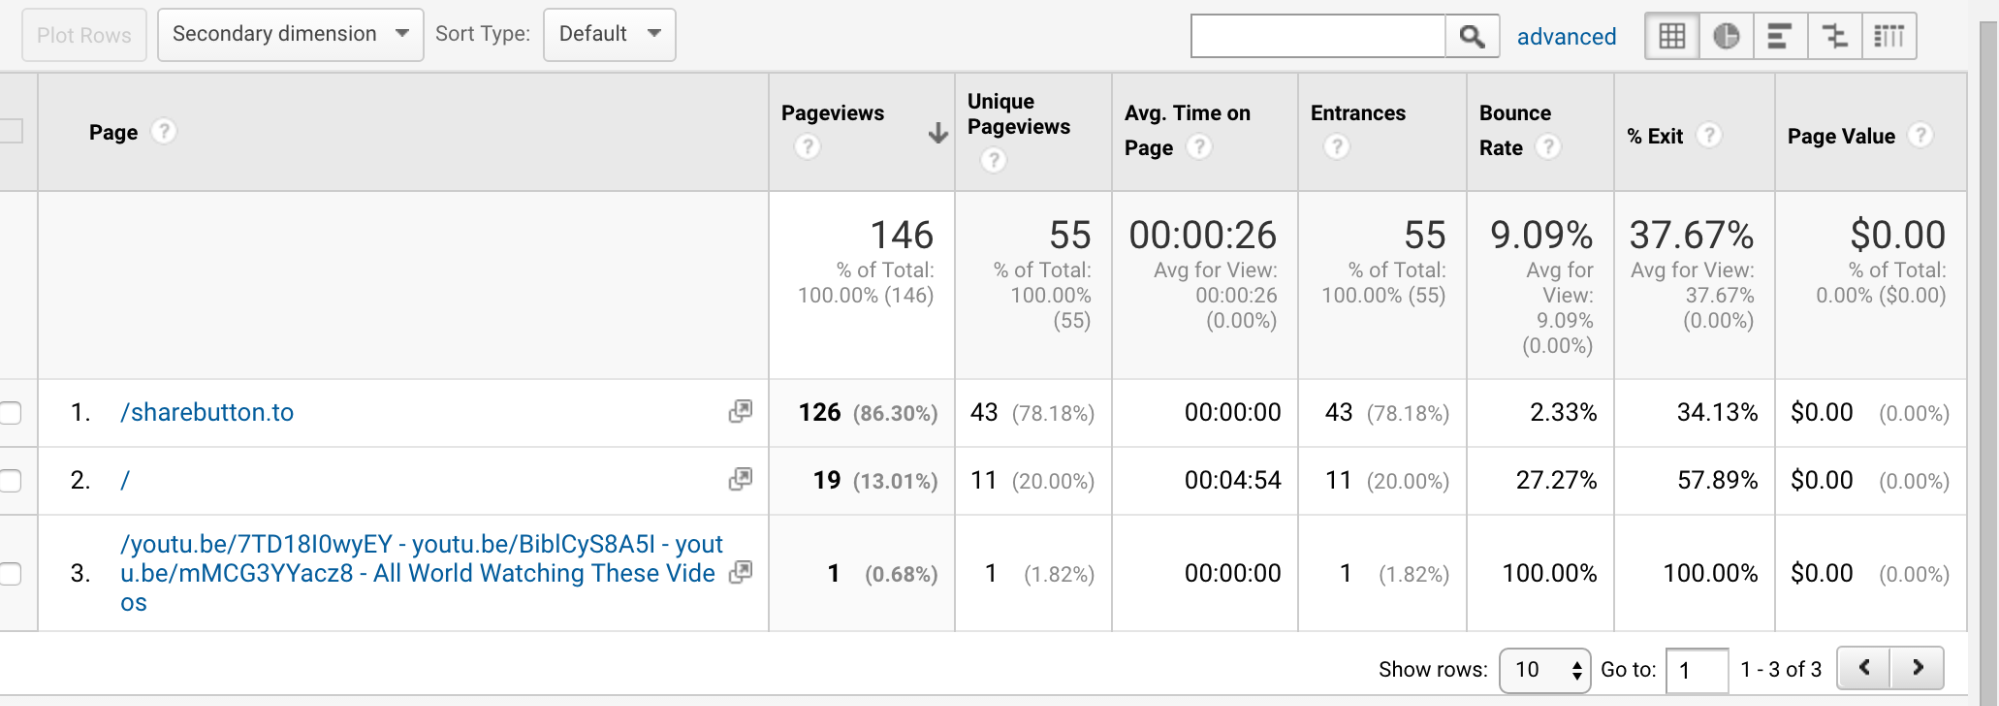
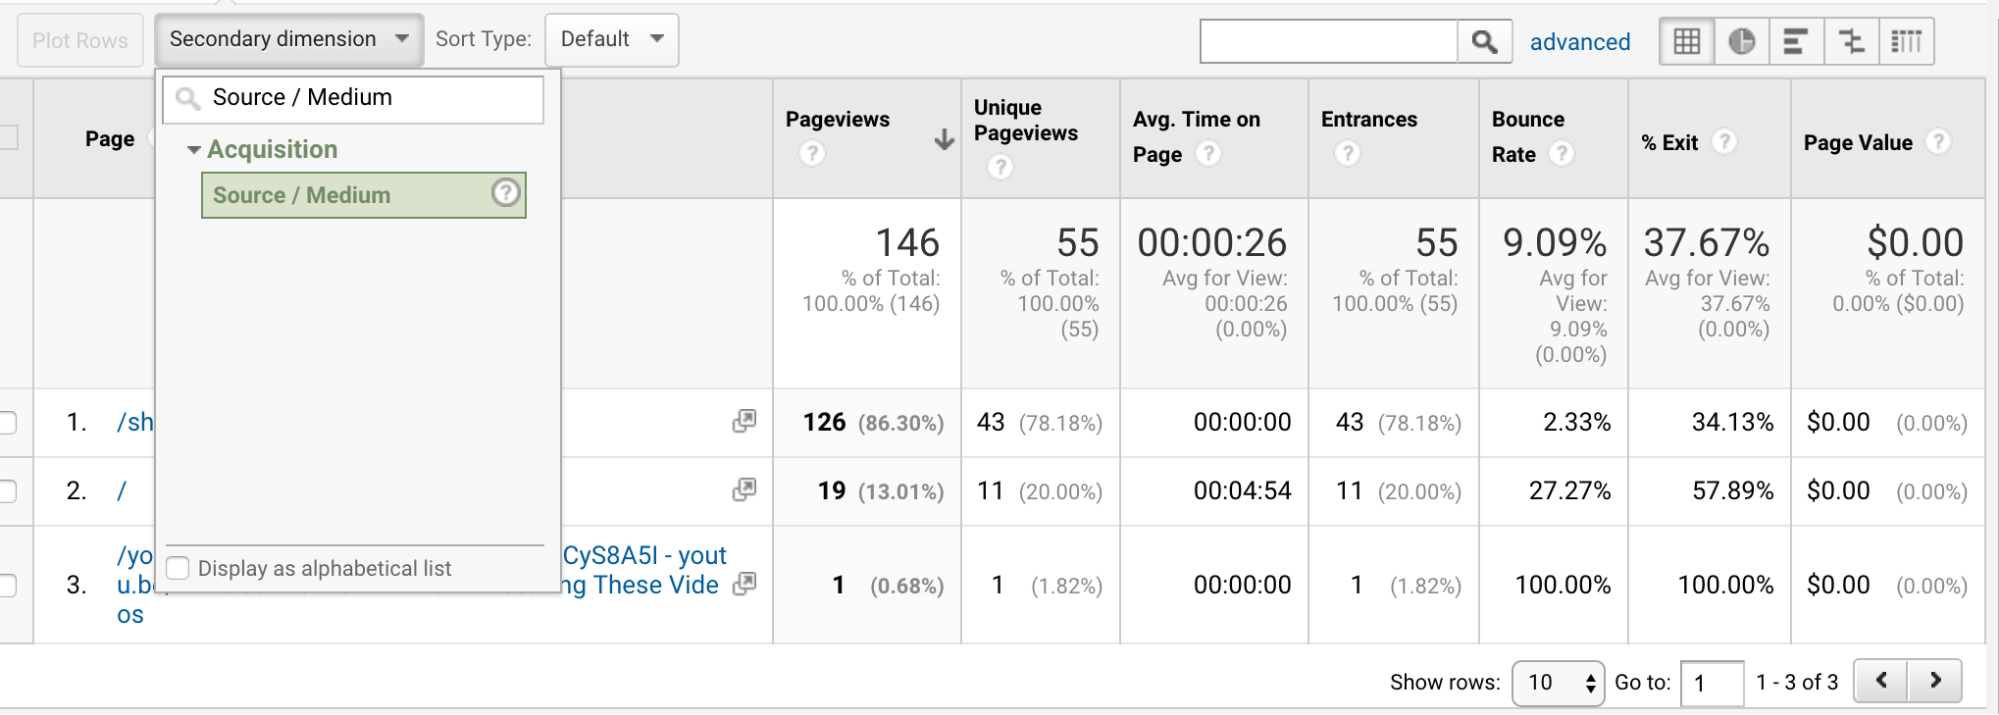
Click on Secondary Dimension and type in Source/Medium.
Next, click on Unique Page views to sort your pages by popularity. The most popular pages will appear on the top.
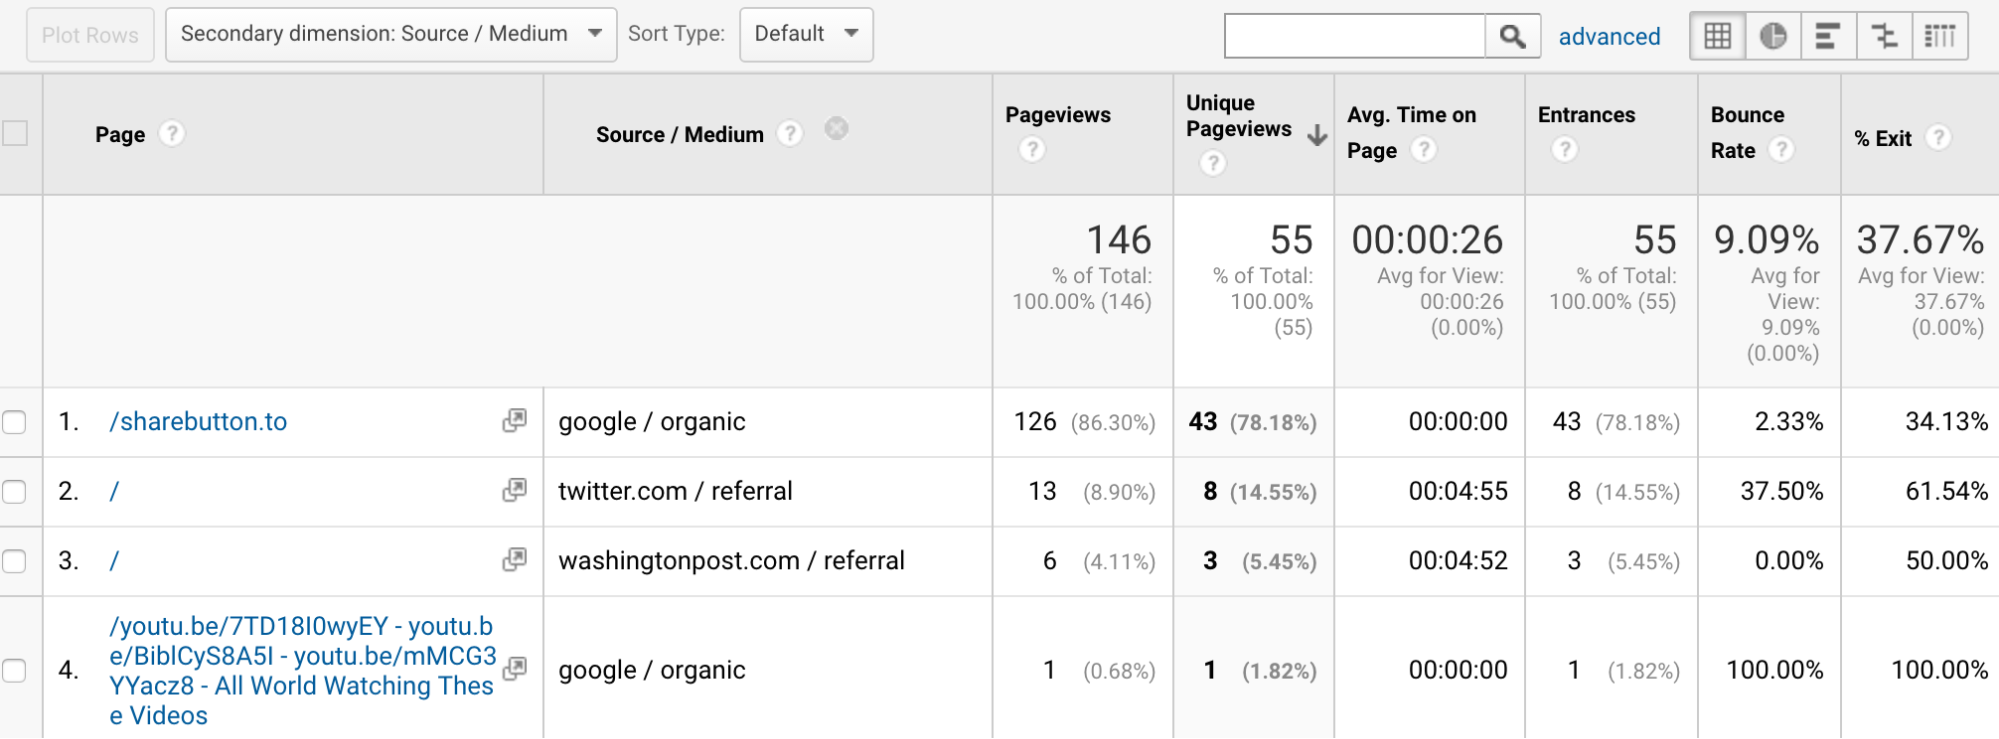
Finally, check the bounce rates for each page.
If you have any popular pages that also have high bounce rates, something’s wrong. This generally means that people are visiting that page, but they’re not finding what they’re looking for.
If this happens, look over your page and make sure that it’s optimized for traffic. Your content might be in need of some touch-ups,or your pop-up may be pushing readers away.
Diagnose the problem and A/B test until you find out what’s causing the problem.
For more tips on improving your bounce rate using GA, check out this Kissmetrics post.
GA provides some pretty nifty tools to hone your marketing strategies.
For example, if you’re getting a high number of visits from a certain country, you can find out in GA. You could use that information to initiate an ad campaign for that country.
You can also compare new visitors with returning visitors, to analyze the difference and spot any weaknesses in your funnels.
These are just two of the ways that you can use advanced segments in GA. The possibilities are endless.
Let’s start by creating a new segment and then exploring the options.
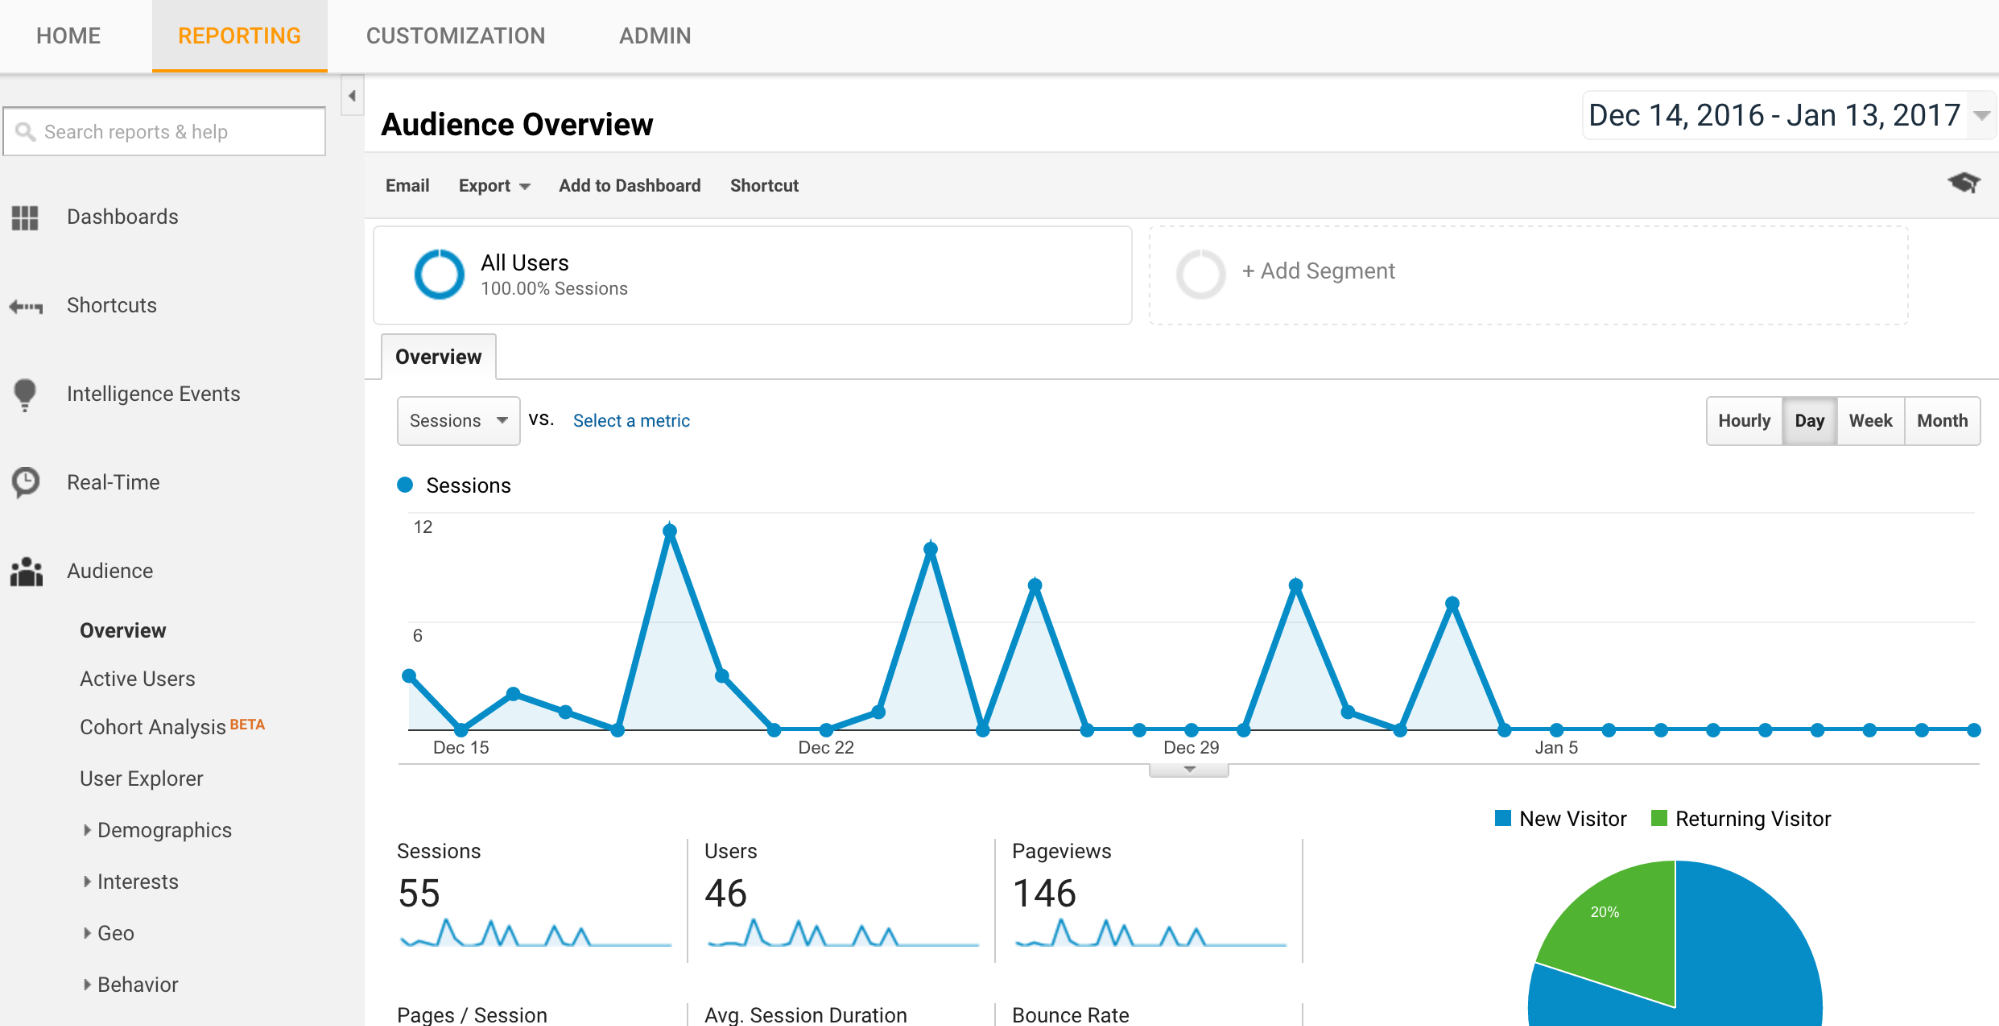
Make sure you’re on the Reporting tab of GA. You should see Audience Overview at the top of the page (If you’re not here, just head to Audience > Overview in the sidebar).
Above the main graph, there’s a box that says “Add segment.”
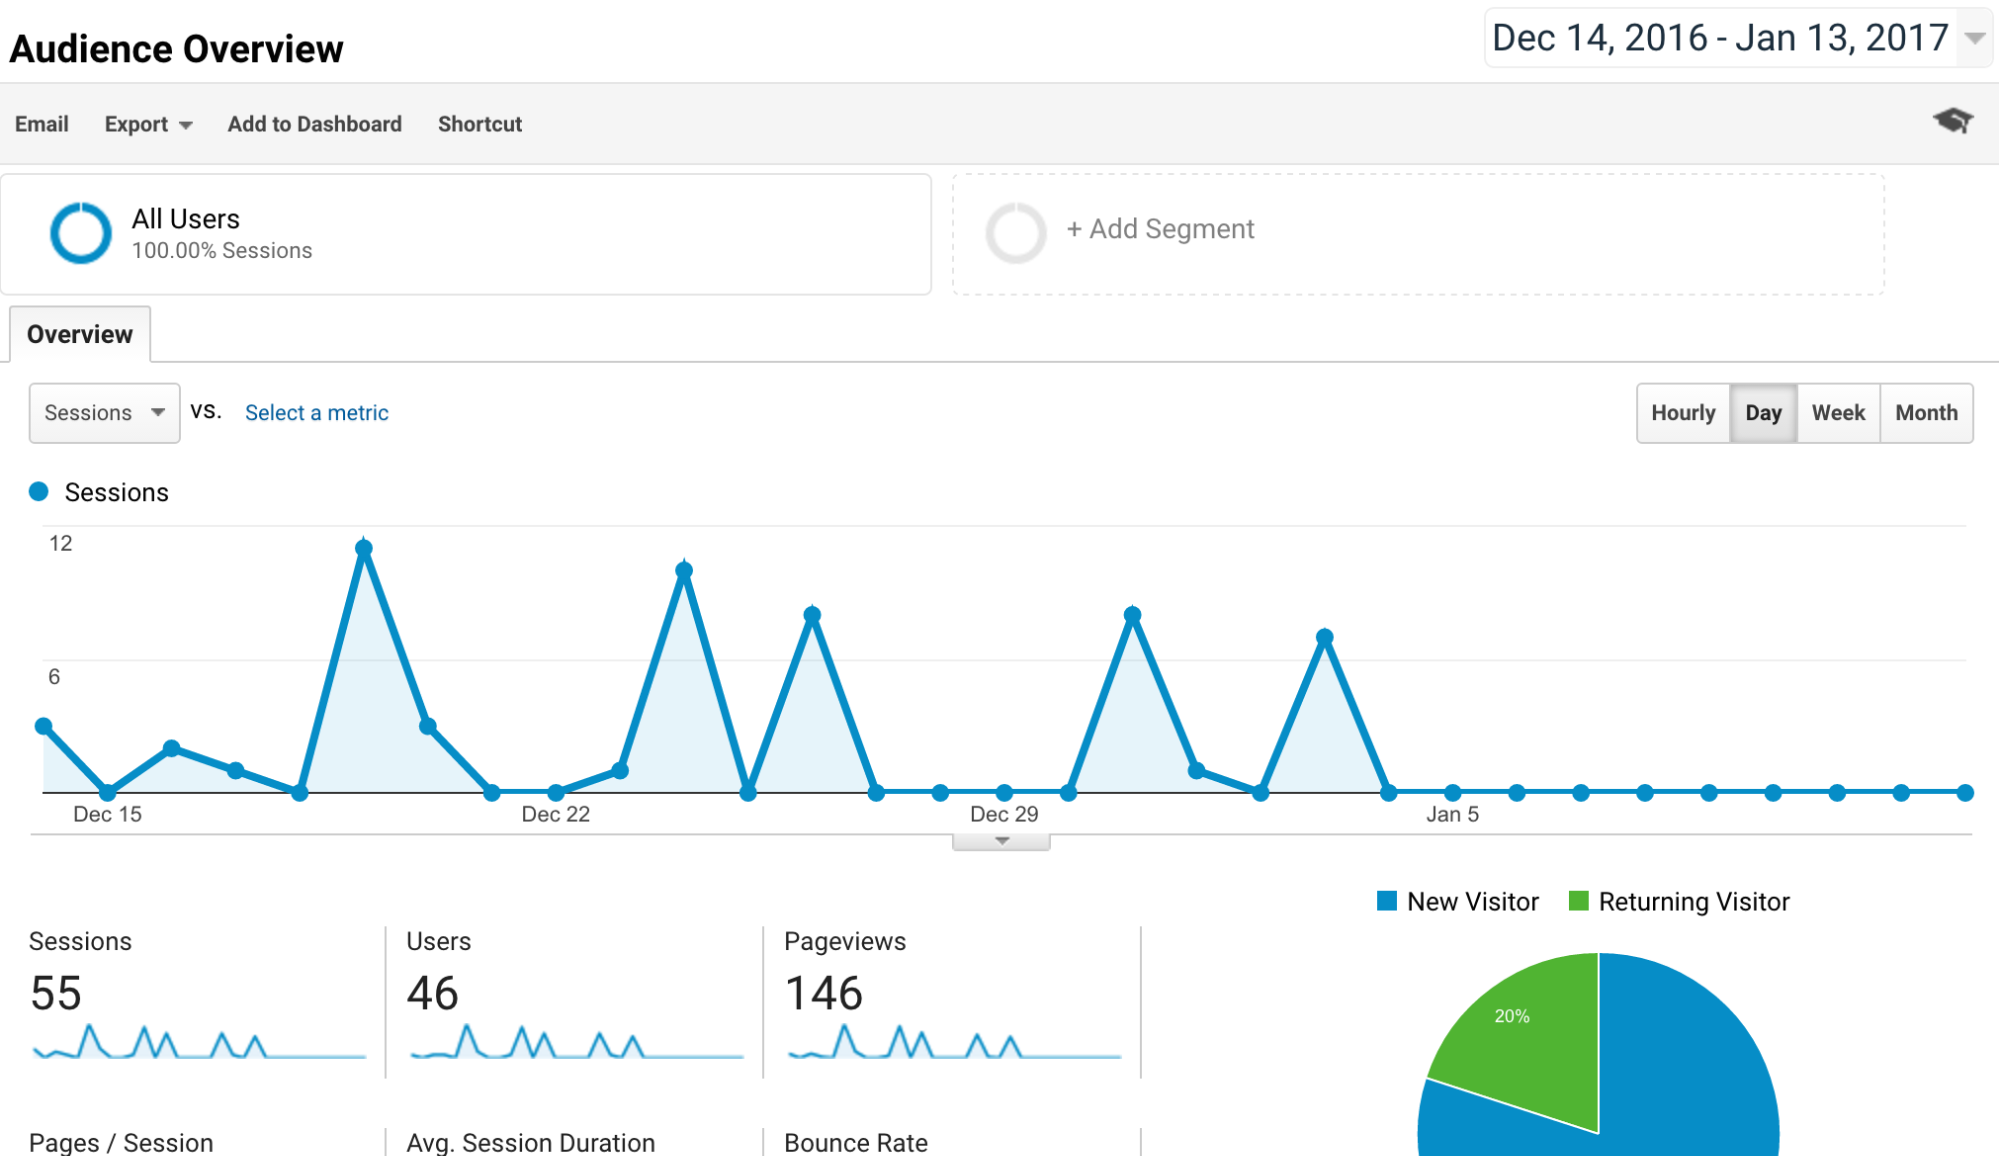
Click on this to start creating a segment.
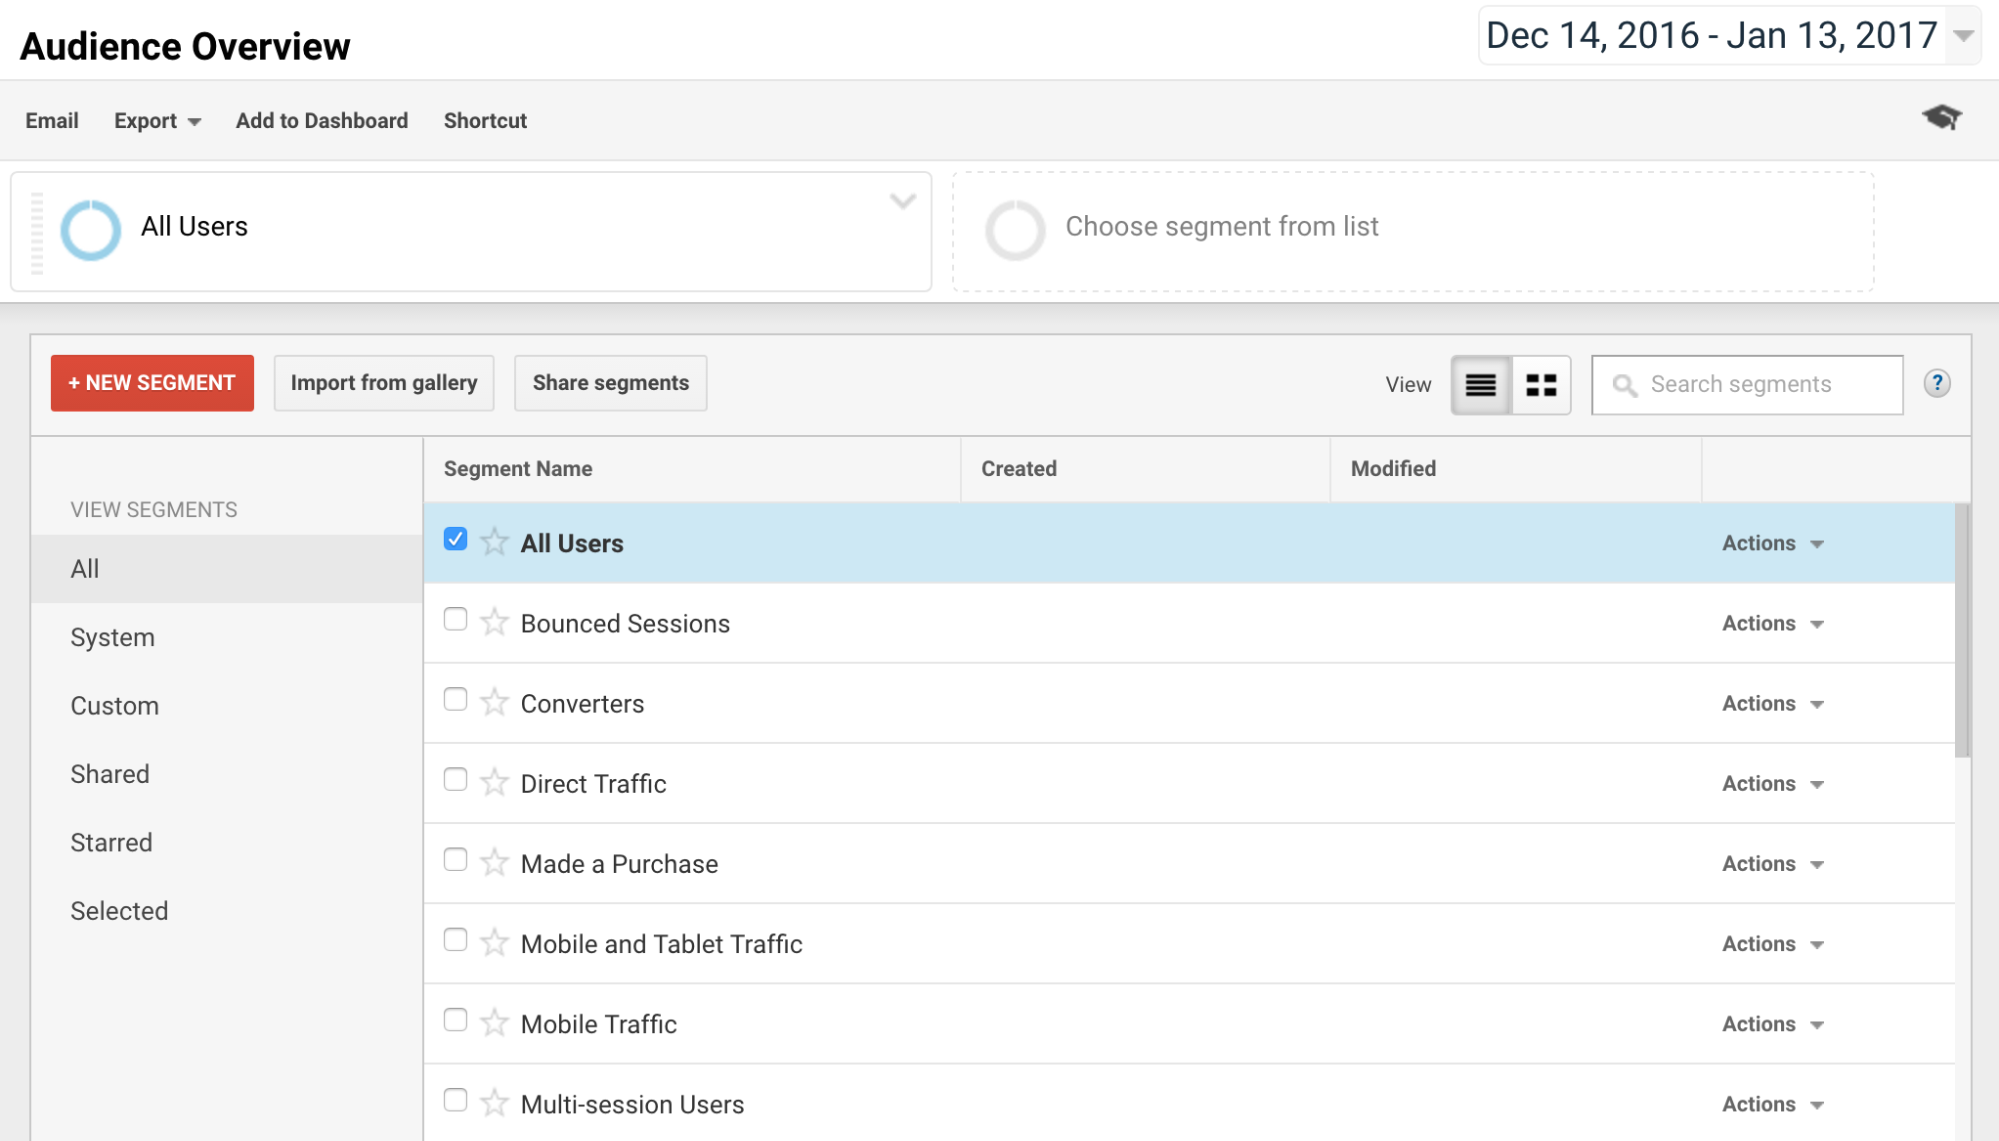
Click on +NEW SEGMENT.
Here’s where you can create custom segments based on almost anything you want.
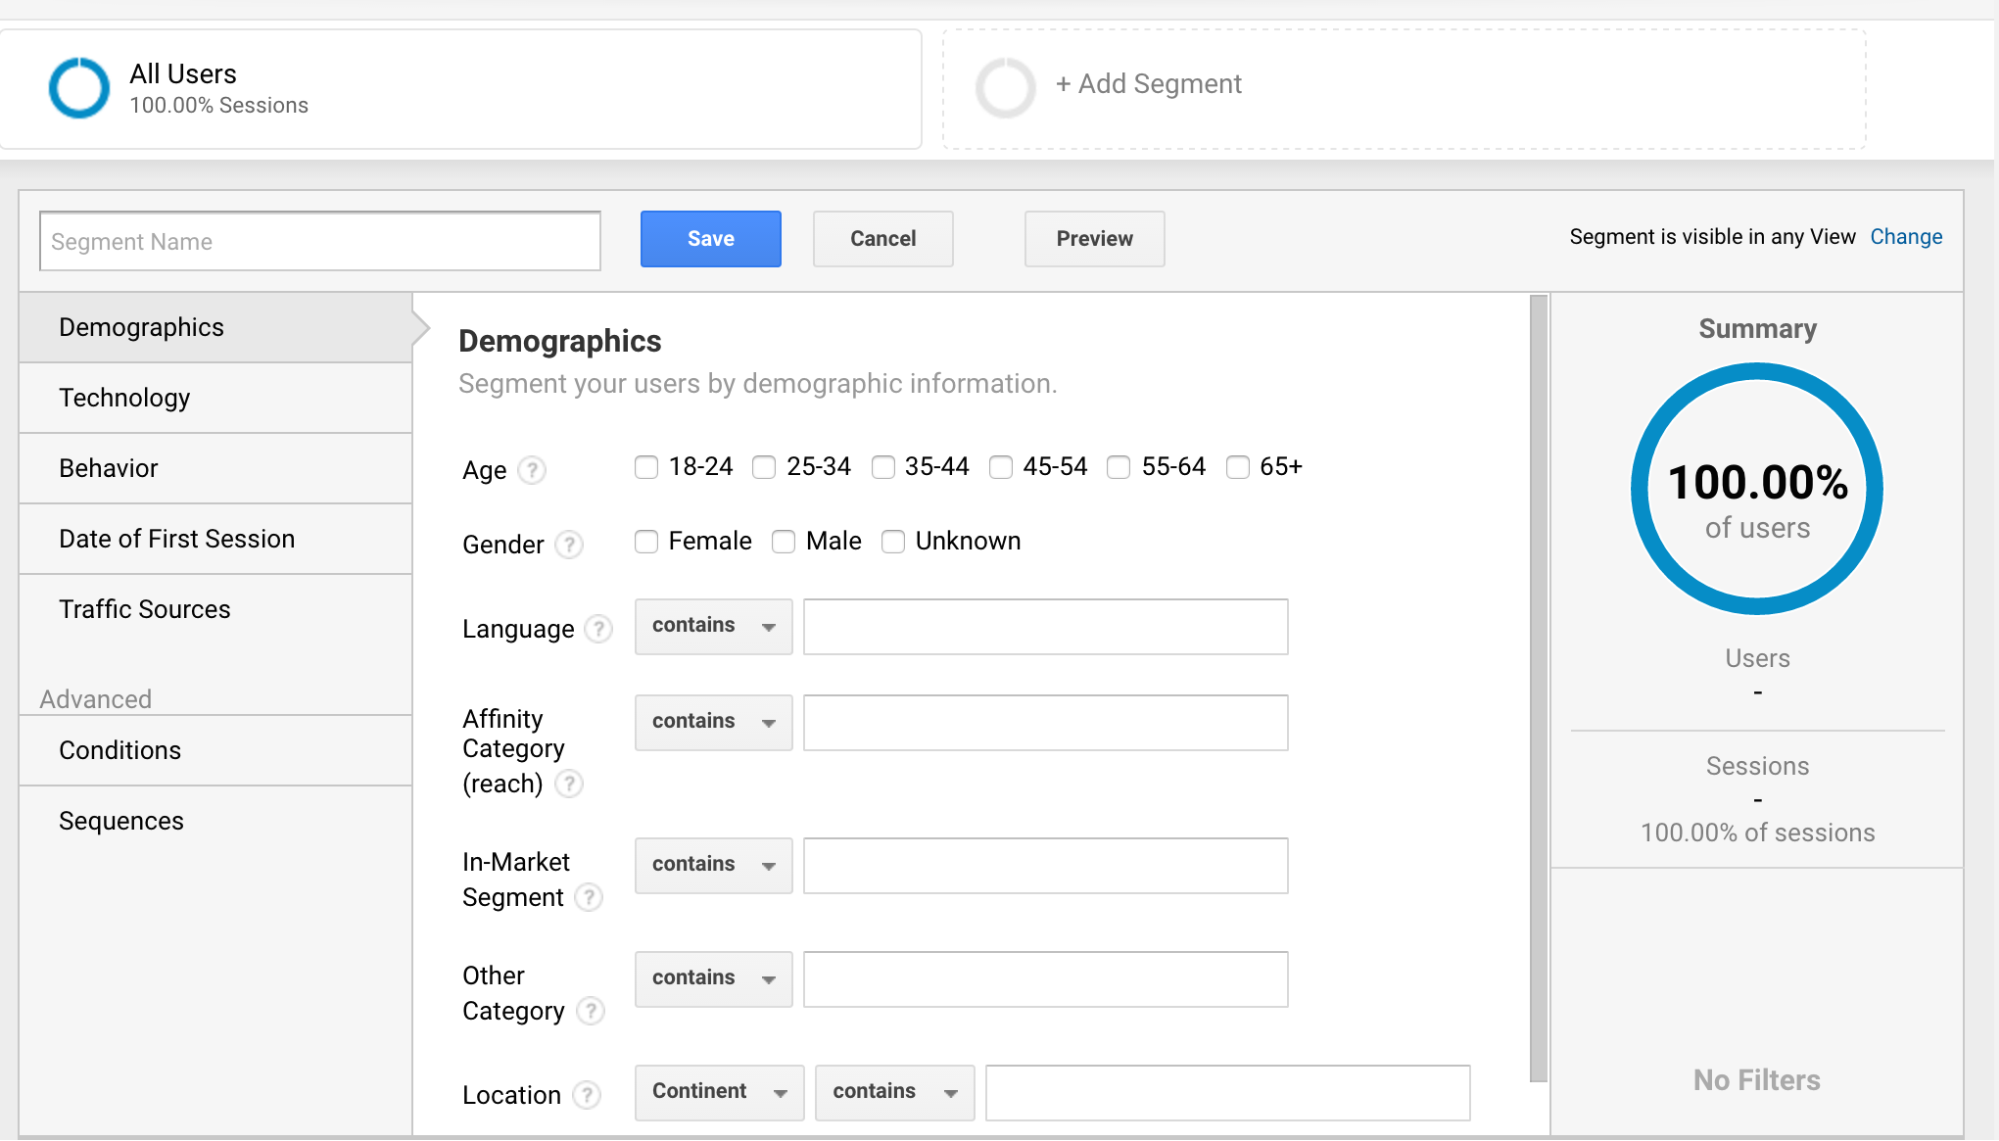
Let’s say you’ve noticed an uptick in your traffic from Canada. You can create a new segment that’s just for your Canadian visitors.
First, give your segment a name.
Next, in the Demographics section of the segment creator, change the Location to Canada. Set the first drop-down to Country and the second to “exactly matches.”
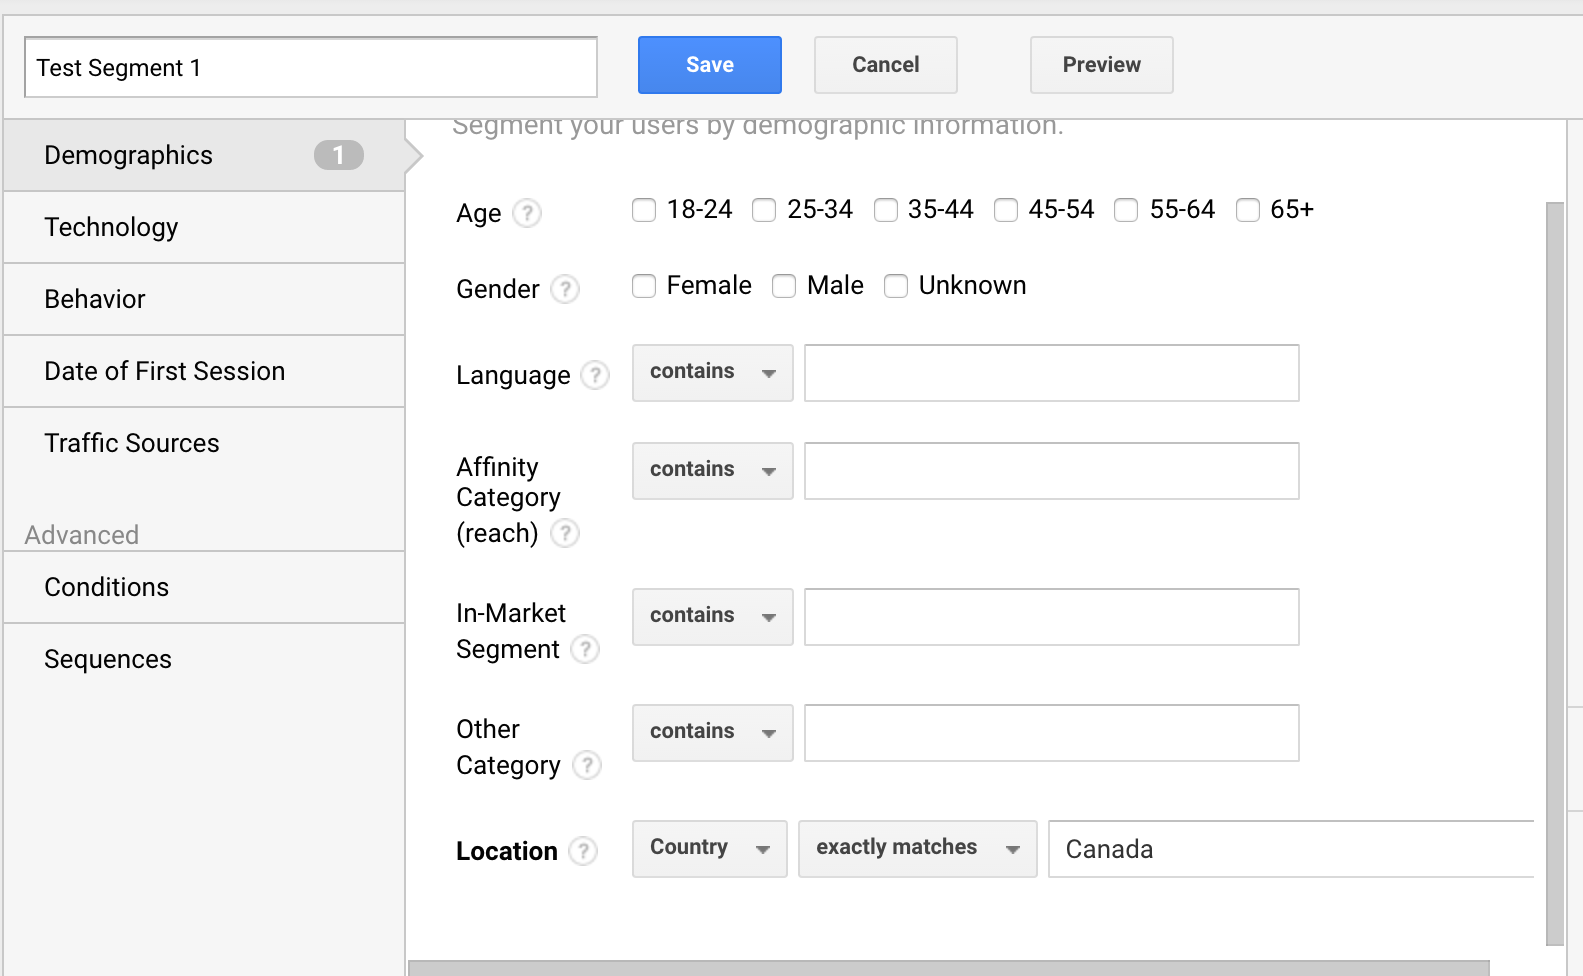

On the Technology tab, you can measure only readers who are using a certain browser or operating system. The Behavior tab is also useful for tracking sessions.
Once you’ve finished editing your segment, you can preview it or you can go ahead and save it.
Segments can mean the difference between results that kind of help and results that blow you away. If you’re serious about digging into your analytics, I think you should become a segmenting master.
Want more information? Here’s how to get even more data from segments.
Google Analytics is an awesome tool that goes into extreme depth, with almost any metric you can think of. And, it’s completely free.
But, when I first started using it, I was a bit confused. It took me a while to learn it. But now that I’ve used it for a while, I know it inside and out.
I guarantee that this 10-minute process will help you get more from your GA, whether you’re brand new to using it or a GA-savvy marketer who just wants to extract the most useful data.
Analytics are important, but you shouldn’t be spending more time on them than you have to.
By getting the most actionable data from GA in a mere 10 minutes, you can focus on other things and worry less about your analytics process.
This article was first published on NeilPatel
- From our Sponsors -